This web page was produced as an assignment for Genetics 677, an undergraduate course at UW-Madison.
What is DNA Phylogeny?
Phylogeny, in general, is the study of the relatedness of groups of organisms through molecular sequencing and morphological (physical) characteristics. These groups of organisms can be different populations of the same organism, so for example two different populations of humans, or different organisms, so humans and chimpanzees. Gene phylogeny involves comparing nucleotide sequences between groups to infer the relatedness of the protein in question. This information can then be used to construct a phylogenetic tree, as shown in Figure 1 below.
Figure 1. The parts of a phylogenetic tree. The taxa in this tree are "human", "mouse", and "fly." Several nodes are indicated, such as the "fly" taxon node and an internal node that represents the common ancestor of mice and humans. The root is indicated at left, representing the common ancestor of all three taxa listed.
Phylogenetic trees are meant to be a visual representation of evolution. As speciation events occur, branch points form, and as particular organisms become extinct, branches terminate. There has been a great deal of debate on how to classify organisms, and this page will focus solely on the protein sequencing methods.
Below there are two examples of two different types of phylogenetic trees. In order to obtain a neighbor joining tree, it is necessary to know the distance between each sequence you are trying to compare [1]. This tree starts out looking like a star, very disorganized, then the algorithm looks for a pair of sequences that are closest together and creates a new node. The length of the branches represent how far apart the sequences are from one another.
The second is an average distance tree, which requires the gene sequences in question to be aligned before analysis. For more on FRMD7 gene alignment, please visit the Gene Homology and Alignments page. Any gap in the alignment is ignored, or counted as a mismatch [2].
ClustalW2 Alignment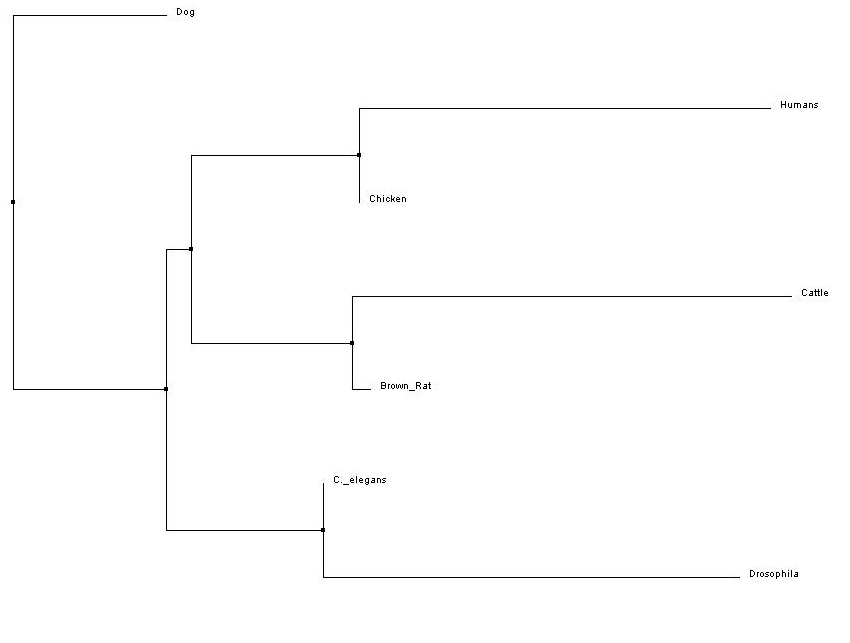
Figure 2. Neighbor Joining (Click to Enlarge)
|
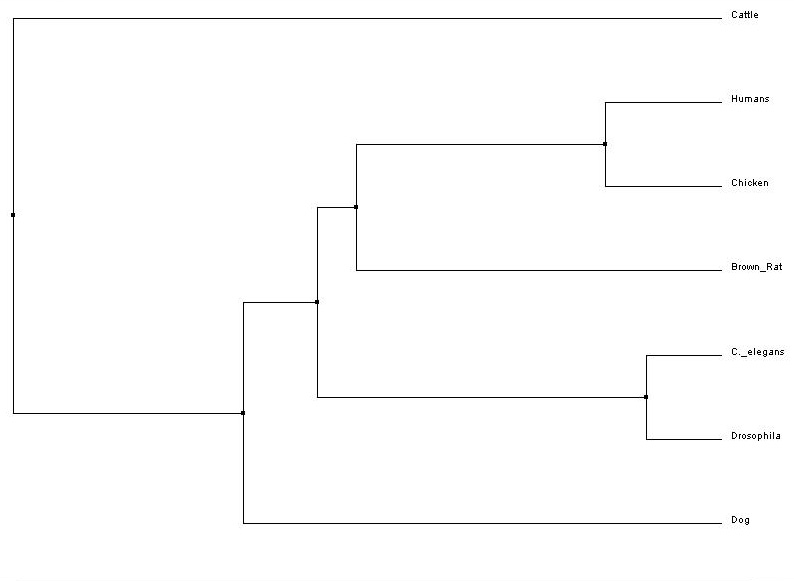
Figure 3. Average Distance (Click to Enlarge)
|
Analysis and Discussion
These two trees, even though they were derived from the same program, ClustalW2, produced very different results. The neighbor-joining tree shows the dog gene as the outgroup and that human FRMD7 gene is most closely related to the chicken FRMD7 homolog. This means that according to ClustalW2, human and chicken FRMD7 homologs are the most closely related.
The second tree, average distance, also shows human FRMD7 gene to be most closely related to the chicken homolog. This tree differs from the neighbor-joining tree in its placement of cattle as the outgroup. This may indicate that while the cattle gene has similar nucleotide sequences to human FRMD7, it may also contain gaps or spaces that caused the program to place these two homologs farther apart than the neighbor-joining tree.
The second tree, average distance, also shows human FRMD7 gene to be most closely related to the chicken homolog. This tree differs from the neighbor-joining tree in its placement of cattle as the outgroup. This may indicate that while the cattle gene has similar nucleotide sequences to human FRMD7, it may also contain gaps or spaces that caused the program to place these two homologs farther apart than the neighbor-joining tree.
References
[1] Didelot, X., Robinson D. A., Falush, D., Feil E. J., (2010).
Sequence-based analysis of bacterial population structures. Bacterial Population Genetics in Infectious Disease 2010(Ch. 3) 46. ISBN: 9780470424742. Retrieved from: http://books.google.com/books?id=gPVjfsWnGCcC&pg=PA46#v=onepage&q&f=false
[2] Mount , D. M. (2004)
Bioinformatics: Sequence and Genome Analysis 2nd ed. Cold Spring Harbor Laboratory Press: Cold Spring Harbor, NY
[3] Dereeper A., Audic S., Claverie J. M., Blanc G. (2010)
BLAST-EXPLORER helps you building datasets for phylogenetic analysis. BioMed Central Evolutionary Biology, 2010(10:8). doi: 10.1186/1471-2148-10-8
[4] Dereeper A., Guignon V., Blanc G., Audic S., Buffet S., Chevenet F., Dufayard J.F., Guindon S., Lefort V., Lescot M., Claverie J.M., Gascuel O. (2008)
Phylogeny.fr: robust phylogenetic analysis for the non-specialist. Nucleic Acids Research. 2008(1;36) W465. doi: 10.1093/nar/gkn180
[5] Edgar R. C. (2004)
MUSCLE: multiple sequence alignment with high accuracy and high throughput. Nucleic Acids Research. 2004(32:5), 1792. doi: 10.1093/nar/gkh340
[6] Castresana J. (2000)
Selection of conserved blocks from multiple alignments for their use in phylogenetic analysis. Molecular Biology and Evolution, 2000(17), 540. Retrieved from: http://mbe.oxfordjournals.org/content/17/4/540.long
[7] Guindon S., Gascuel O. (2003)
A simple, fast, and accurate algorithm to estimate large phylogenies by maximum likelihood. Systems Biology. 2003(52), 696. doi: 10.1080/10635150390235520
[8] Anisimova M., Gascuel O. (2006)
Approximate likelihood ratio test for branchs: A fast, accurate and powerful alternative. Systems Biology. 2006(55), 539. doi: 10.1080/10635150600755453
[9] Felsenstein J. (1989)
PHYLIP - Phylogeny Inference Package (Version 3.2). Cladistics, 1989(5), 164. Retrieved from: http://www.citeulike.org/user/rvosa/article/2346707
Site created by: Kristen Klimo
Last updated: 5/11/2012
University of Wisconsin-Madison
Last updated: 5/11/2012
University of Wisconsin-Madison
